Compute \(P(F)\).
\(\frac{27}{120} = \frac{9}{40}\)
|
Previous
10.2 Dependent and independent events
|
Next
10.4 Tree diagrams
|
In the rest of this chapter we will look at tools and techniques for working with probability problems.
When working with more complex problems, we can have three or more events that intersect in various ways. To solve these problems, we usually want to count the number (or percentage) of outcomes in an event, or a combination of events. Venn diagrams are a useful tool for recording and visualising the counts.
The diagram below shows a general Venn diagram for \(\text{3}\) events.
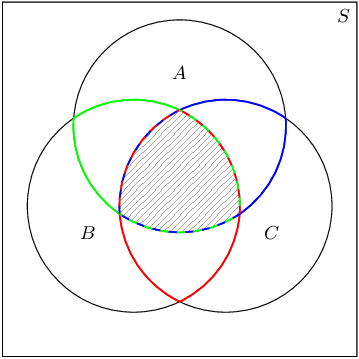
Write down the sets corresponding to each of the three coloured regions and also to the shaded region. Remember that the intersections between circles represent the intersections between the different events.
What is the event for
Draw a Venn diagram that shows the following sample space and events:
The sample space contains all the positive integers up to \(\text{30}\). \[S = \{1; 2; 3; \ldots; 30\}\]
The prime numbers between \(\text{1}\) and \(\text{30}\) are \[P = \{2; 3; 5; 7; 11; 13; 17; 19; 23; 29\}\]
The multiples of \(\text{3}\) between \(\text{1}\) and \(\text{30}\) are \[M = \{3; 6; 9; 12; 15; 18; 21; 24; 27; 30\}\]
The factors of \(\text{30}\) are \[F = \{1; 2; 3; 5; 6; 10; 15; 30\}\]
There are \(\text{3}\) events, namely \(P\), \(M\) and \(F\), and the sample space, \(S\). Put this information on a Venn diagram:


At Dawnview High there are \(\text{400}\) Grade \(\text{11}\) learners. \(\text{270}\) do Computer Science, \(\text{300}\) do English and \(\text{50}\) do Business studies. All those doing Computer Science do English, \(\text{20}\) take Computer Science and Business studies and \(\text{35}\) take English and Business studies. Using a Venn diagram, calculate the probability that a pupil drawn at random will take:
We need to be careful with this problem. In the question statement we are told that all the learners who do Computer Science also do English. This means that the circle for Computer Science on the Venn diagram needs to be inside the circle for English.


To find the number of learners taking English, but not Business studies or Computer Science, we need to look at this region of the Venn diagram:
The count in this region is \(\text{15}\) and there are a total of \(\text{400}\) learners in the grade. Therefore the probability that a learner will take English but not Business studies or Computer Science is \(\frac{15}{\text{400}} = \frac{3}{80}\).
To find the number of learners taking English but not Business studies, we need to look at this region of the Venn diagram:
The count in this region is \(\text{265}\). Therefore the probability that a learner will take English but not Business studies is \(\frac{\text{265}}{\text{400}} = \frac{53}{80}\).
To find the number of learners taking English or Business studies but not Computer Science, we need to look at this region of the Venn diagram:
The count in this region is \(\text{45}\). Therefore the probability that a learner will take English or Business studies but not Computer Science is \(\frac{45}{\text{400}} = \frac{9}{80}\).
To find the number of learners taking English or Business studies, we need to look at this region of the Venn diagram:
The count in this region is \(\text{315}\). Therefore the probability that a learner will take English or Business studies is \(\frac{\text{315}}{\text{400}} = \frac{63}{80}\).
There are some words that tell you which part of the Venn diagram should be filled in. The following table summarises the most important ones:
| Words | Symbols | Venn diagram |
| “all” | \(A \text{ and } B \text{ and } C\) / \(A \cap B \cap C\) | 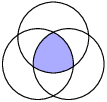 |
| “none” |  |
|
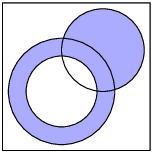
| “at least one” | \(A \text{ or } B \text{ or } C\) / \(A \cup B \cup C\) | 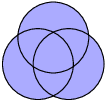 |
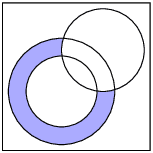
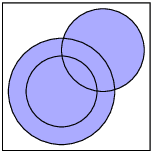
| “both A and B” | \(A \text{ and } B\) / \(A \cap B\) |  |
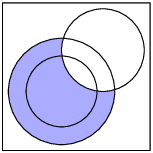
| “A or B” | \(A \text{ or } B\) / \(A \cup B\) |  |
Use the Venn diagram below to answer the following questions. Also given: \(n(S) = \text{120}\).
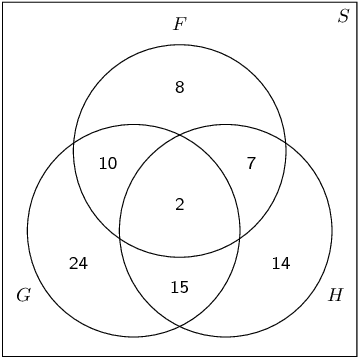
\begin{align*} P(F) \times P(G) &= \frac{9}{40} \times \frac{51}{120} \\ &= \frac{153}{1600} \end{align*} and \[P(F\text{ and }G) = \frac{1}{10}\] Therefore \(P(F\text{ and }G) \ne P(F) \times P(G)\) and the events are dependent.
The Venn diagram below shows the probabilities of \(\text{3}\) events. Complete the Venn diagram using the additional information provided.

After completing the Venn diagram, compute the following: \[P\left(Z\text{ and not }(X\text{ or }Y)\right)\]
The completed Venn diagram is below.
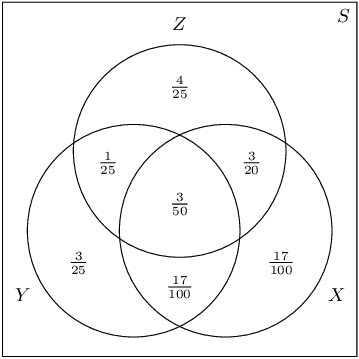
\(\left(Z\text{ and not }(X\text{ or }Y)\right)\) is the top part of \(Z\), which excludes all of \(X\) and \(Y\). Therefore \(P\left(Z\text{ and not }(X\text{ or }Y)\right) = \frac{4}{25}\).
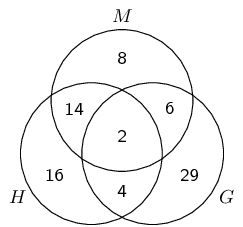
There are \(\text{79}\) Grade \(\text{10}\) learners at school. All of these take some combination of Maths, Geography and History. The number who take Geography is \(\text{41}\); those who take History is \(\text{36}\); and \(\text{30}\) take Maths. The number who take Maths and History is \(\text{16}\); the number who take Geography and History is \(\text{6}\), and there are \(\text{8}\) who take Maths only and \(\text{16}\) who take History only.
Each student must do exactly one of the following:
Each learner must do exactly one of the following:
Each learner must take exactly one of:
Draw a Venn diagram with \(\text{3}\) mutually exclusive events. Use the diagram to show that for \(\text{3}\) mutually exclusive events, \(A\), \(B\) and \(C\), the following is true: \[P(A\text{ or }B\text{ or }C) = P(A) + P(B) + P(C)\]
This is the addition rule for \(\text{3}\) mutually exclusive events.
Recall for events to be mutually exclusive, they must have no elements in common. This mean that in the Venn diagram there must be no overlap between any of \(A\), \(B\) and \(C\).

From the Venn diagram we can see that the probability of the three events together is simply the sum of their individual probabilities. So \(P(A\text{ or }B\text{ or }C) = P(A) + P(B) + P(C)\). This will be true for any mutually exclusive events since they never overlap in the Venn diagram.
|
Previous
10.2 Dependent and independent events
|
Table of Contents |
Next
10.4 Tree diagrams
|